
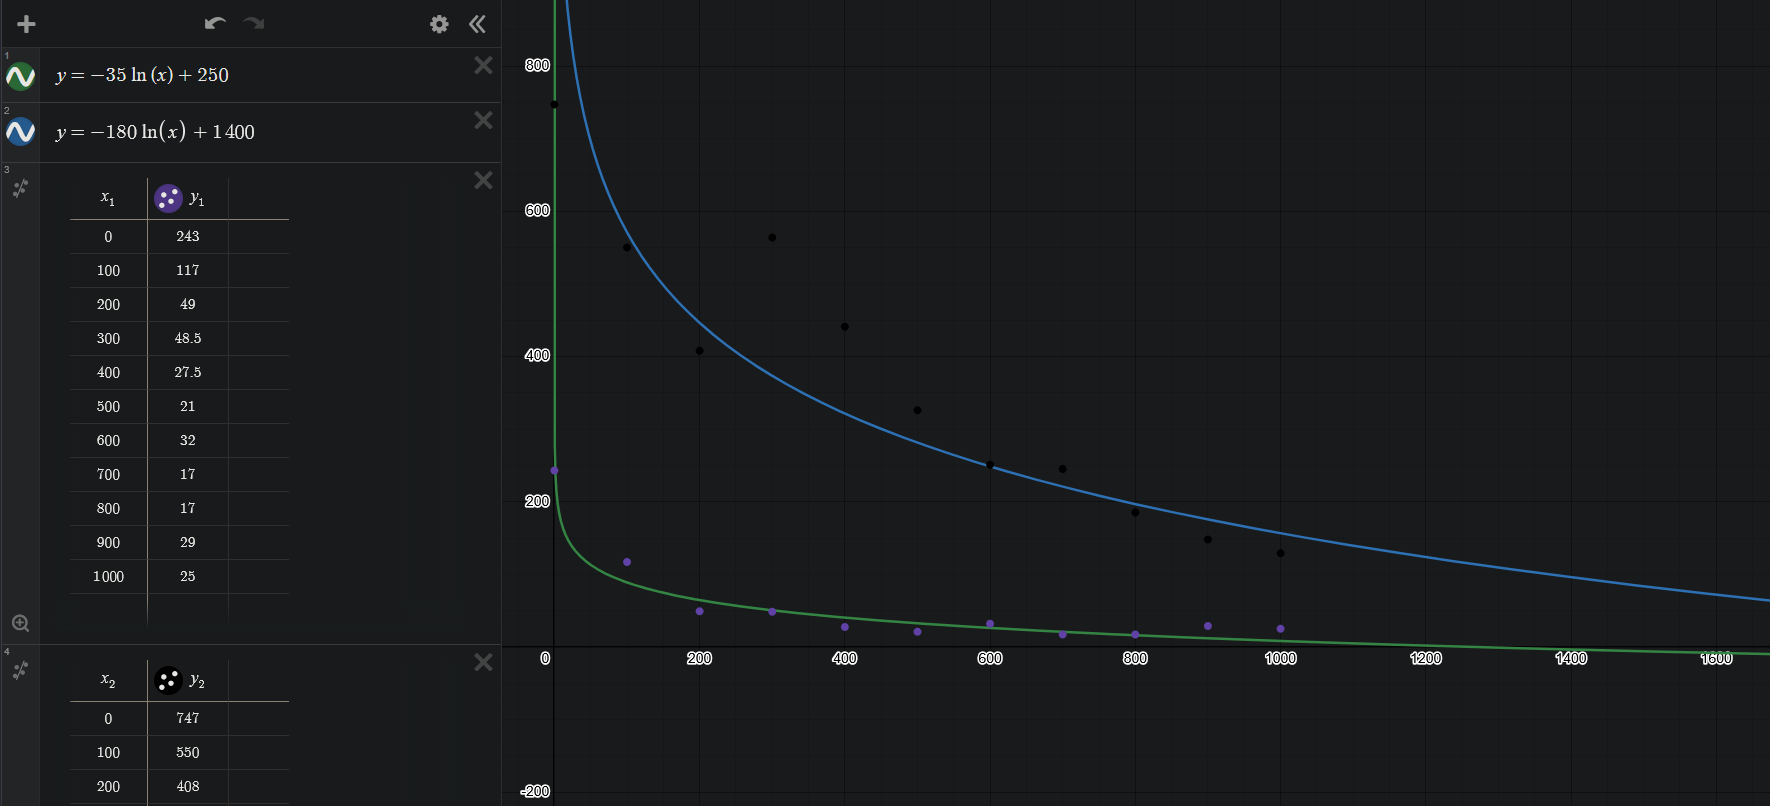
I've been playing The Finals a lot recently and was looking at the player count, and thinking, "hmm, that looks a lot like a natural log graph" (like anyone does) So I took the SteamDB player data over the past 2 years and put it into Desmos, and tried to fit a ln function to it. I cut down the player counts to their thousands, i.e. 650,000 = 650, just so that it scaled better.
It honestly worked pretty well. So I took another game, Battlefield 6, and put that in, and I had to do a bit more tweaking but it also fit decently (save for the outlier points where a new season got released). The Blue line/Black dots is BF6 and the Green/Purple is The Finals.
I'm sure you could do this with most games, but I think it works better with online games, where there's a lot of hype in the beginning and then it falls off into a more steady/consistent playerbase.
Posted by Th3Bl1ndDrag0n
1 Comment
Do the Hunt Showdown next